

The statistical evaluation of the farm’s annual documentation can be carried out both from the cultivation data and from a labour management perspective via the tasks.
Statistical data in the form of tables and diagrams are available in the statistics section of the cultivation planner. This is divided into the following subsections:
- Fields and beds
- Crops
- Harvests
- Nursery
- Tasks
- Task duration
- Task notes
8.1 Fields and beds
Area statistics: Shows all fields and, if applicable, plots with number of beds, area size/division, occupied bed metres and area as well as the annual utilisation of the planned crop sets resulting from existing bed metres and those occupied with sets over the year. Utilisation values > 100% result from multiple beds (in the example below e.g. on bed 1 baby leaf, aubergine and rocket) or even sets with time overlaps – not present in the example, but can be planned with the program.
Click on the field name to switch to the corresponding field. Clicking on the number ‘Number of beds’ shows the statistics for each bed in the field. The last row of the table (‘Total’) shows the totals of all columns, with the exception of the last column ‘Utilisation’, which shows the average of all utilisation values. The utilisation of individual fields can be opened by clicking on the row of the field table.
Here is an example of a 267 m² fully planted greenhouse area with 13 beds, each 20 metres long…

…and the associated statistics of the field and its beds:

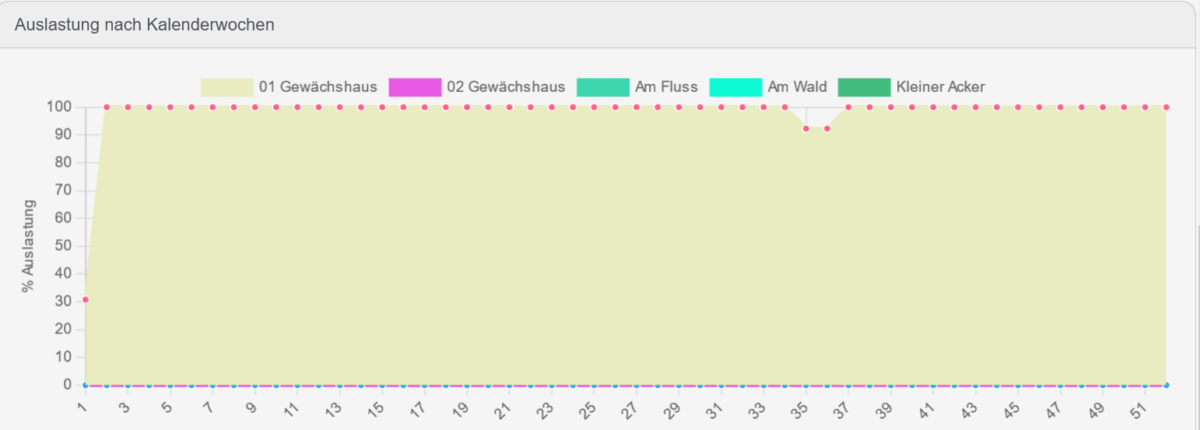
The diagram below the table shows the percentage utilisation of all beds over the year. Here is the graph for our example field: In week 1, only four of 13 beds are occupied, so the utilisation graph is just over 30% and only reaches its maximum in week 2. The small kink in week 35-36 is the small occupancy gap on bed 13, which reduces the overall utilisation slightly. Click on a rectangle in the legend above the diagram to show or hide it.
8.2 Crops
Crop statistics: The table lists all crops for which crop sets are planned in the selected year. For each crop, the number of sets, length of the set(s) in bed metres, percentage share of the total bed metres and area share in square metres. In the case of carrots, for example, the beds have not been planned at all in the programme, hence zero m² in the last column.

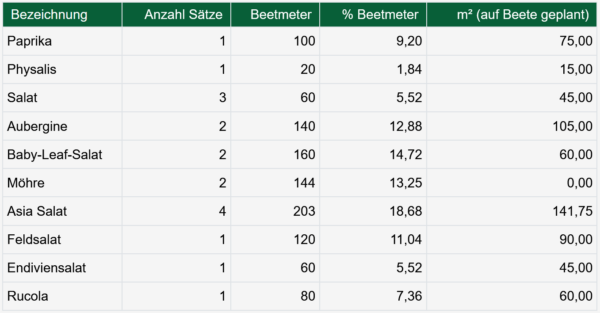
The pie chart shows the percentage bed metre share of each crop in the total available bed metres of the farm. The total bed metres are calculated from all the planned sets of a crop in the season. The advantage of this overview is that you can recognise at a glance the crops that dominate in terms of area and those that are less area-intensive and can use this knowledge base to better assess the decision to add or reduce crops.
8.3 Harvests
Harvests statistics: This table shows the total harvest quantity in relation to bed metres and acreage. In addition to the yield per bed metre and area, the harvest weights and the entered average weight per unit (for crops with the unit kg = 1) are also shown if the option ‘Convert unit to kg’ is selected in the harvest recording.
 The cultivation time and cultivation periods (cultivation, bed cultivation period, harvest) for each crop set are also shown on the right (not shown in the table). The average growing period, cultivation period and harvesting period are determined and displayed from this.
By clicking on the number of sets in brackets, a list of all sets planned for the respective crop in the cultivation year can be expanded.
Sets with missing information, e.g. sets not yet planned on areas (e.g. baby leaf lettuce 3) are displayed in red, as the statistical calculation cannot be carried out completely here.
The export button on the left above the table can be used to export it as an Excel file.
8.4 Nursery
Nursery statistics: In the cultivation area statistics, the first column of the table shows the number of sets with cultivation in the cultivation year and the calendar week with the highest number of sets present at the same time.

Column two shows the week with the highest number of multipot plates used and the week with the highest cultivation area utilisation. The volume of all multi-pot trays and the substrate required for the entire year’s cultivation are also determined here.
The upper diagram shows the utilisation of space for growing in multipot trays or other growing containers over the entire growing year.
The lower diagram shows the number of multipot trays required over the year, broken down by calendar week. This makes it possible to read off the required plate amounts. Peaks in the planning can be recognised and reduced.

All pot and plate types created (under Farm/Area parameters) are displayed and extrapolated to the weekly requirement from the data in the planned cultivation sets.
As with the other diagrams in the statistics section, the respective category can be hidden by clicking on the boxes above the coordinate system to display the categories below.
8.5 Tasks
-
- Task duration

- Task duration
Documentation of the total task duration is shown here using the task stopwatch in the mobile app or by entering time in the tasks in the calendar or times recorded on the set or field.
Depending on the assignment of the task per crop, set or stroke, the task duration can be displayed in the various tabs.
An Excel export of the data can be created by clicking on the export button on the left above the table.
-
- Task notes
The table tabs show task notes for all tasks with or without a reference. 
Here too, an Excel export of the data can be created by clicking on the export button on the left above the table. As can be seen here in the example, the fertiliser and crop protection documentation can be entered in the task notes and printed out or made available digitally for inspection using the export function.